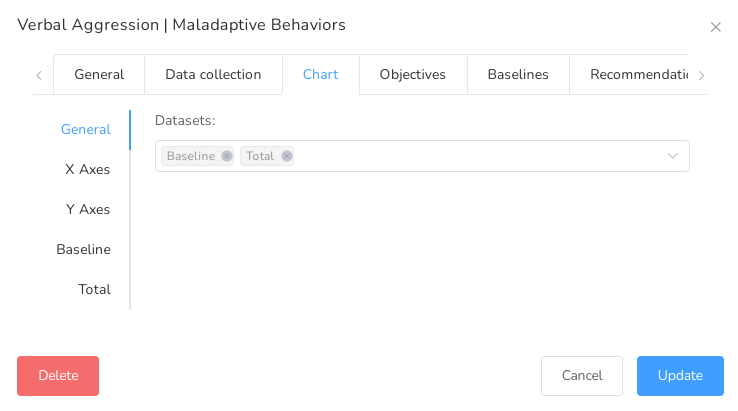
List of some of the datasets to be displayed in the chart.
| Dataset | Description |
| Baseline | Expected behavior of data, used for comparative purposes. |
| Average | Average of values through a day, week, month, or year. |
| Total | The total value of data during a day, week, month, or year. |
| Rate | Occurrence of an event during a unit of time. |
| Count | The total value of data collected. |
| Session count | Count of sessions during a day, week, month, or year. |
Other features available such as:
- Show multiple datasets at the same time on the same chart.
- Customize X and Y axis (Title, Position, Font size, Label rotation, Max value, Min value, Step Size, etc.).
- Customize each dataset (Title, Associated axis, Type, Point Style, Colors, etc.).
- Show ignored dates and values.
- Show the data in daily, weekly, monthly, or yearly intervals.
Check Chart’s Configuration lesson for extended information about it.