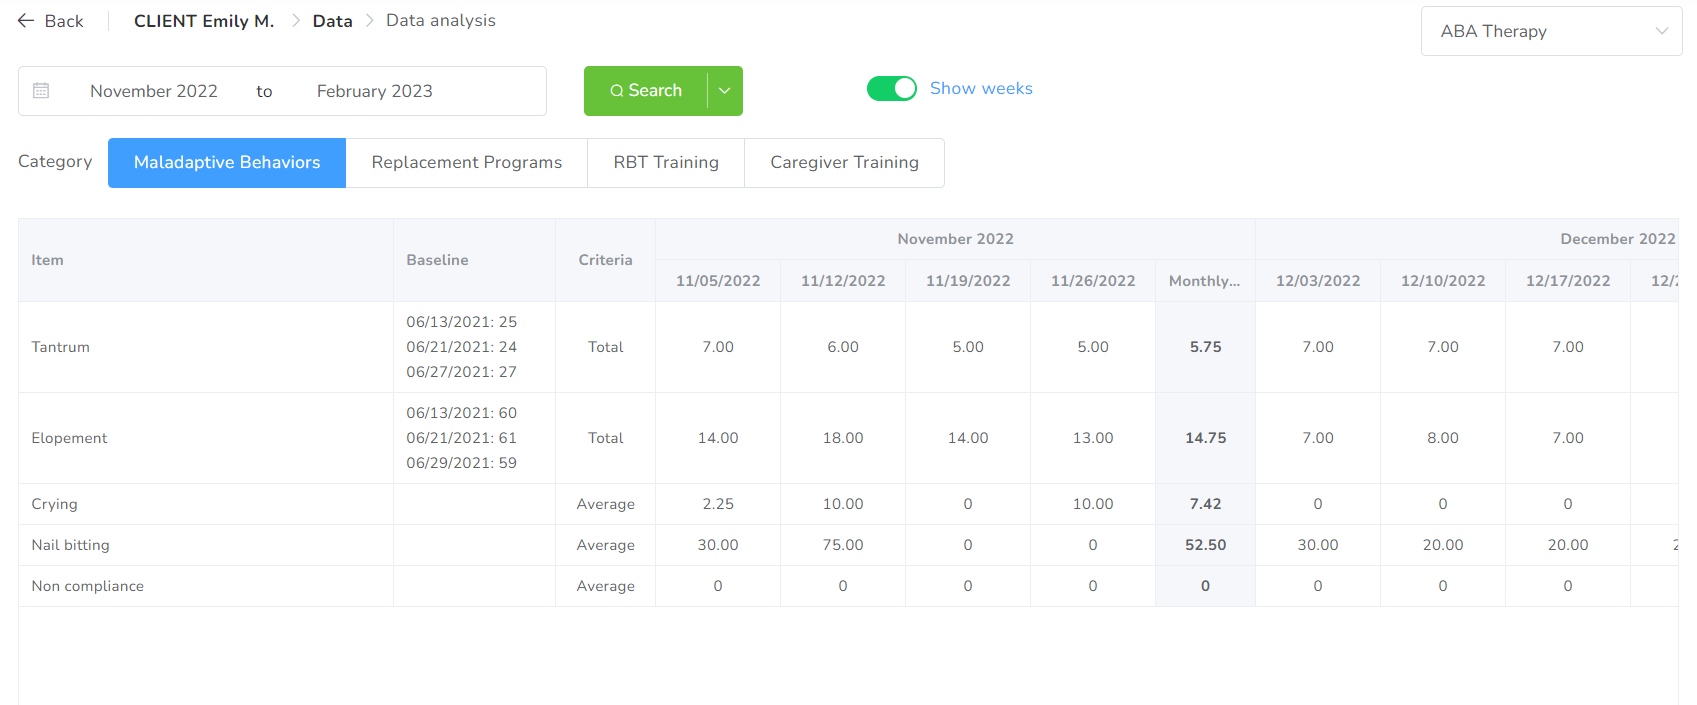
This section allows you to analyze data in a tabular format, focusing on weekly/monthly changes.
Dates
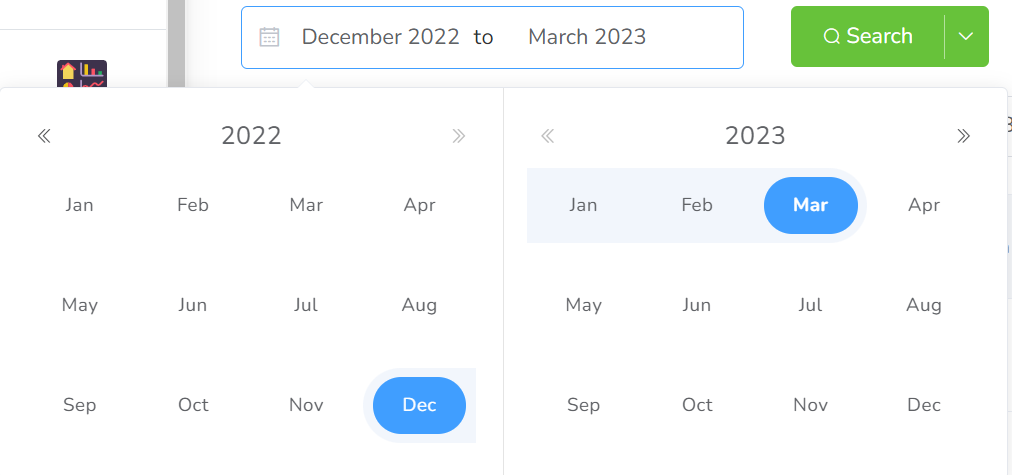
You can change the dates in the top left-corner selector. Please be aware that the list of available data will depend also on the approved start/end dates for every element in the Service Plan. By default, the last four months are displayed.

If you need a more detailed analysis, you can display the data values in weeks by turning the Show weeks switch green.
Categories

You can show the datasheets for a given category by clicking on the top of it. The active category will be displayed in blue. Your list of categories might be different if the Service Plan has category names.
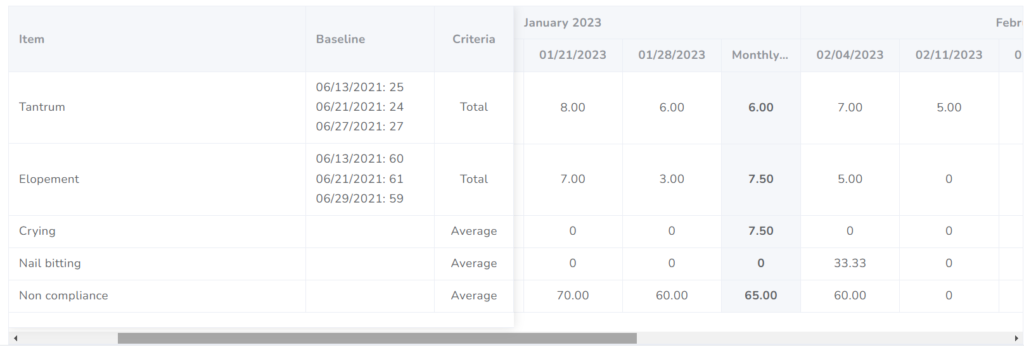
You can move between months in the table by dragging the bar below the table.
Export
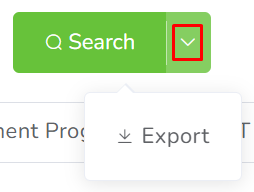
You can export this analysis in an Excel document for your device.