Graph
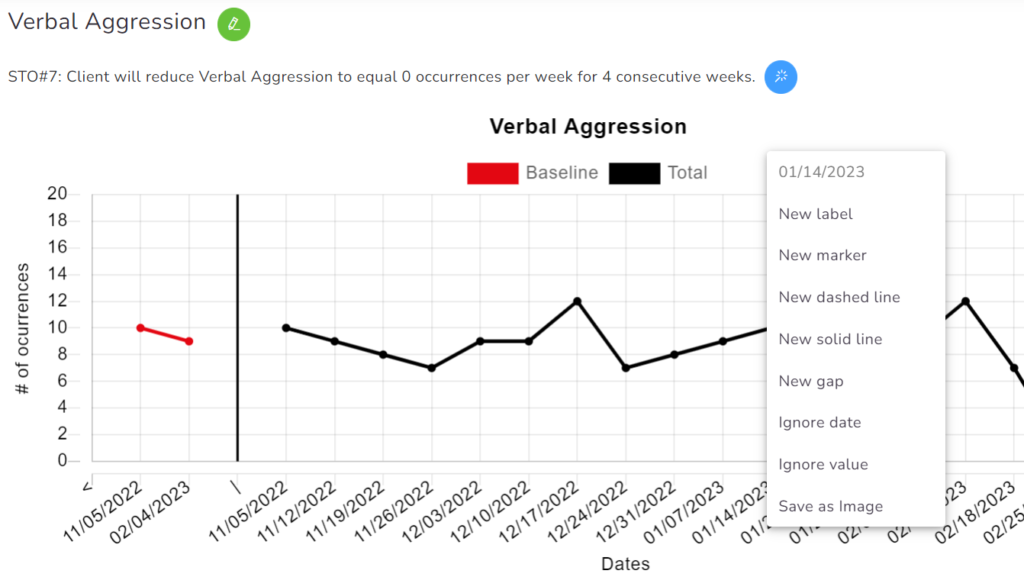
All charts will show their name at the top, followed by the current Objective (if available).
You can quickly edit the Service Plan item using the green pencil button right next to the name.
You can quickly validate the current objective by clicking the blue magic wand button right next to the objective’s name.
Annotations
You can add annotations by right-clicking on the top of the chart.
- New label – used for short text strings.
- New marker – It adds a marker on the graph, as well as a Legend, just below the Chart.
- New dashed line & new solid line – It’s used to mark specific points, with phase or change lines.
- New gap – It will split 2 data points, creating a space between them.
- Ignore date – Hide the value and date.
- Ignored value – Hide the value, creating a gap but with the date.
- Save as image – Save the chart to your computer as an PNG file.
The system will ask if you want to add these annotations to the Chart you’re editing or to all charts. If you want it to be in only one, select No, otherwise select Yes.
To remove the labels, markers, dashed/solid lines and gaps, you only need to right-click on them, and select Delete.
Ignored values and dates can be restored within the item’s Configuration, in the Chart tab, and deleting the value/date and the gap will disappear from the chart.