The service plan is the blueprint of how the platform understands to work with the client.
This section is only available for providers with Level 2 or higher. But we still recommend for providers with Level 1 to get familiar with the configuration because this will decide how they work with the client.
Creation

You can create 1 service plan for each service offered by the Agency.
For this, you must click the “New service plan” button and select the appropriate service.
Categories

Each service plan will contain categories that will within contain Items. Depending on the type of service will depend on the categories to be created. This is the sole decision of the provider creating the Service Plan.
The examples categories displayed above are taken from an ABA Therapy service plan.
There is no limit to the number of categories you can create for a Service Plan.
You can add categories by editing the service plan itself.
Items
Items are elements that belong to a specific category in the service plan.
There are several tabs when creating a new service plan item, here is a summary of them.
| Tab | Description |
| General | All the basic information required such as Name, Position, Category, Start/End Date, Active, and description. |
| Data collection | Configuration required for data collection. Depends on the type of data collection selected. |
| Chart | Configuration required for charts. Includes the Datasets and X/Y Axes details. |
| Objectives | List of objectives for this service plan item and its current progress and monitoring rules. |
| Baselines | List of all baselines collected for this service plan item. |
| Recommendations | All the recommendations given for this service plan item, that will later be passed on to the rest of the providers associated with the case. |
| Imported Data | Raw data to be imported into the system. Useful when bringing data from another source other than the platform. |
General Tab
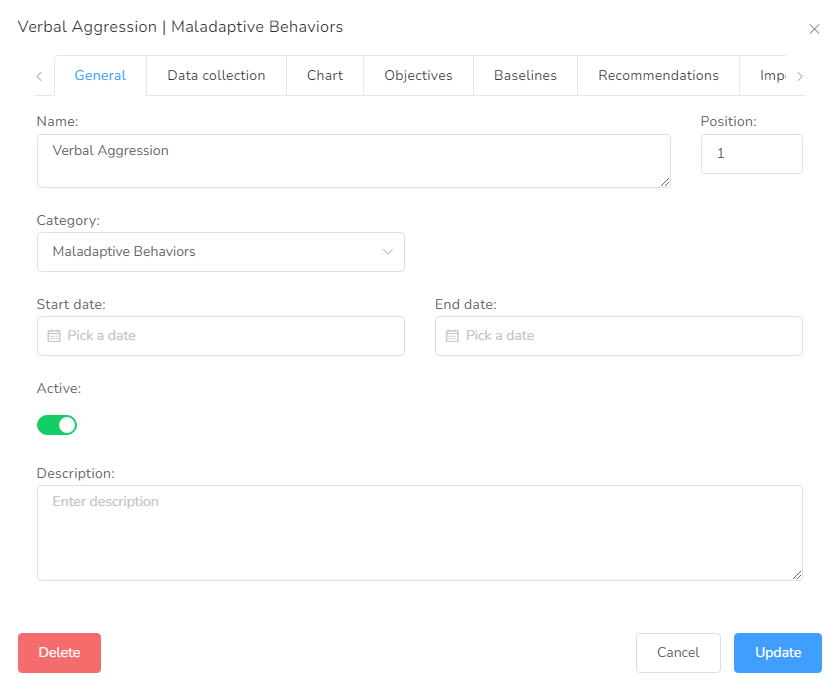
Name
The actual name of the element of the service plan.
Position
Position of the element inside the service plan.
Category
Category this service plan belongs to, useful if it needs to be changed.
Start date
The initial date associated with this element is useful to determine the first day data will be collected or displayed inside a document.
End date
The last date associated with this element is useful to determine the last day data will be collected or displayed inside a document.
Active
If this element is active or not. Useful also to prevent the element to appear in other places.
Description
Longer definition of the element, typically a full narrative description.
Data Collection Tab
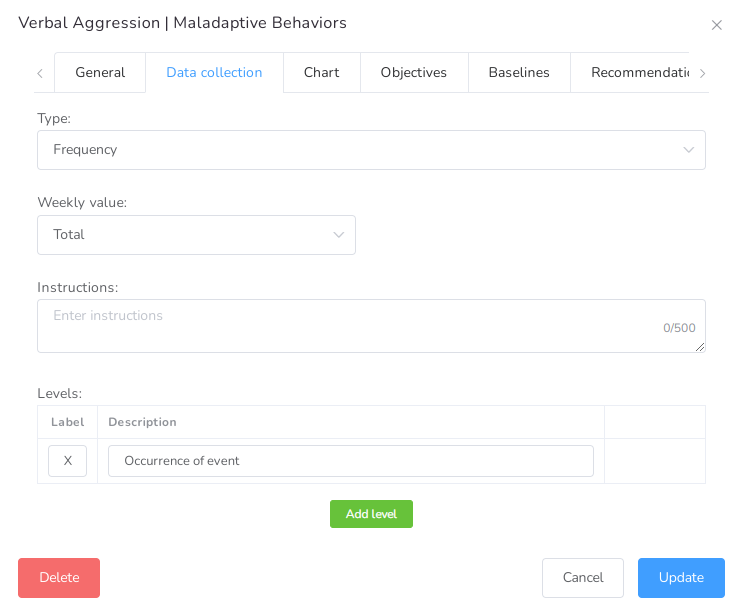
Type/Method
We have implemented more than 15 data collection methods, please refer to the following table for more details.
| Type | Description | Methods |
| Event Recording | The number of occurrences by a unit of time. Ex: hour, day, week, interval. | Frequency, Count, Rate |
| Time Sampling | Collect data at periodic points in time or time periods rather than on a consistent basis. | Whole Interval, Partial Interval, Momentary Time Sampling |
| Timing | Length of time the behavior, or event occurred. | Duration, Response Latency, Interresponse Time |
| Trial | Several ways to easily record whether a response has been Correct, Incorrect, or there was no response to the test applied. | Discrete Trial Teaching, Incident Teaching, Percentage of Opportunities |
| Task analysis | Task analysis is used to break complex tasks into a sequence of smaller steps or actions. | Forward Chaining, Backward Chaining, Total Task Chaining, Backward Chaining with Leaps Ahead |
Suggested number of recordings
Expected number of recordings for this element of the service plan. It is a suggestion, so they could go over this number.
Daily Value
Value calculated for the day, possible choices are: Total or Average.
Weekly Value
Value calculated for the week, possible choices are: Total or Average.
Instructions
These instructions notes are given for the user collecting the data, this will be displayed in the datasheet.
Unit of time
Determines the unit of time of the recording
Interval Length
Used for interval base collection methods to determine the interval length (in the unit of time)
Levels
If you would like to personalize the levels of data, you can do so by adding different Labels that will become the legend used.
Chart Tab
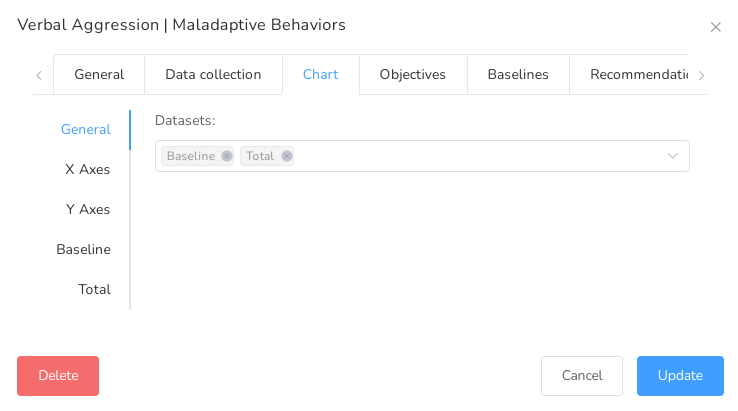
List of all the datasets to be displayed in the chart.
| Dataset | Description |
| Baseline | Expected behavior of data, used for comparative purposes |
| Average | Average of values through a day, week, month, or year |
| Total | The total value of data during a day, week, month, or year |
| Rate | Occurrence of an event during a unit of time |
| Count | The total value of data collected |
| Session count | Count of sessions during a day, week, month, or year |
Other features available such as:
- Show multiple datasets at the set time on the same chart
- Customize X and Y axis (title, color, max value, min value, etc.)
- Customize each dataset (title, color, associated axis, type, etc.)
- Add tags, solid, dashed, and dotted lines
- Show the data in daily, weekly, monthly, or yearly intervals
Objectives
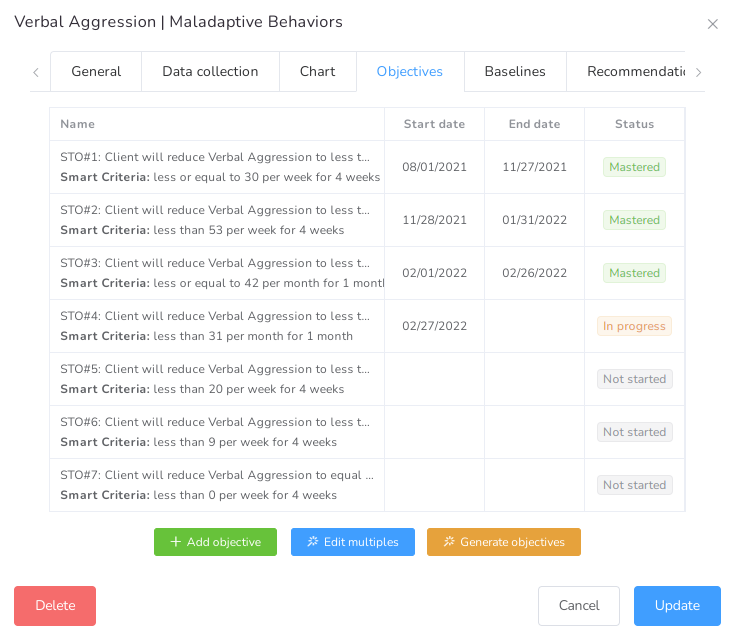
This will set up and track the progress of this element based on the data available in the system. Each objective has a specific configuration that determines how the system will track the objective.
Smart Objective
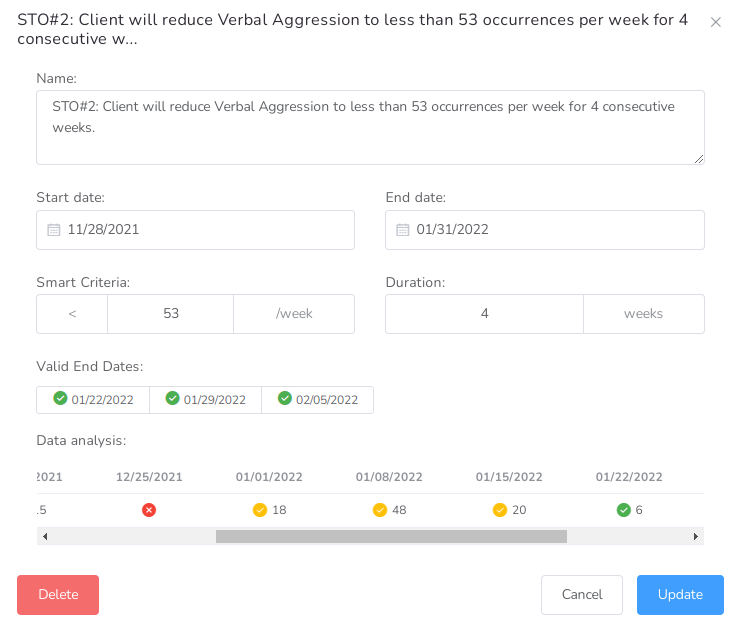
Name
The name of the objective.
Start Date
The start date from which this objective will be monitored.
End Date
The end date for this objective, after which the next objective in the list will be monitored.
Smart Criteria
This is the logic representation of the objective, you need to explain in mathematical terms how the objective will be monitored.
Valid End Dates
If all fields above are completed and there is data collected, Valid End Date will list all dates considered to be valid. This is used to determine the End Date automatically.
Data Analysis
This table will represent the data for each interval defined in the Smart Criteria, with different color codes to determine completion.
Baselines Tab
You can add all the baselines available by clicking “Add Baseline Button”.
Date
The date associated with this baseline.
Value
The value for this baseline.
Period
The period this baseline represents, available options are Day and Week.
Imported Data
If you have existing data collected outside of Office Puzzle, you can import the data for each element in the service plan by simply converting your data to the format “DATE;VALUE”.
DATE
You can put the DATE value in any of the following formats:
- MM/DD/YYYY (Ex: 10/01/2021)
- YYYY-MM-DD (Ex: 2021-10-01)
- YYYY/MM/DD (Ex: 2021/10/01)
VALUE
The value that will be associated with this DATE, this value is expected to be a NUMBER and shouldn’t contain any letters or sign. For example, if your value is 10% the input should be “10”.