In this section, you will be able to find and visualize in a table form all the events that belong to every client and user in the agency. Right next to the Date, you will see an alert icon that will point you to the status of this event.

Filters

In the different boxes, you can search by applying the following filters:
- Range: You can select the start and end day you wish to filter for.
- Provider: You can select the providers you wish to filter for.
- Type: You can select the event types you wish to filter for.
Alerts

Next to each event, you will have an icon representing the alerts associated with it. The possible options are:
- Success (green checkmark), represents the event is fulfilling all applicable policies.
- Warning (yellow exclamation), represents there might be an issue but is not fully required.
- Error (red x mark), representing the event is throwing an error.
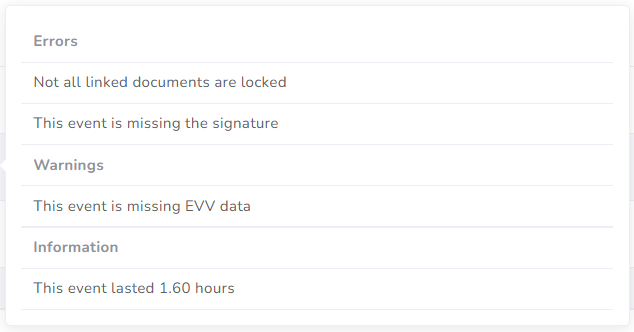
If you hover over the icon, you will get all applicable messages:

This is just an example, depending on your agency there will be a difference in the alerts you might receive here.
Actions

You can access the event by clicking the blue pencil button in the last column of each row.
